Serial axes coordinates
coord_serialaxes.RdIt is mainly used to visualize the high dimensional data set either on the parallel coordinate or the radial coordinate.
Arguments
- axes.layout
Serial axes layout, either "parallel" or "radial".
- scaling
One of
data,variable,observationornone(not suggested the layout is the same withdata) to specify how the data is scaled.- axes.sequence
A vector with variable names that defines the axes sequence.
- positive
If
yis set as the density estimate, where the smoothed curved is faced to, right (positive) or left (negative) as vertical layout; up (positive) or down (negative) as horizontal layout?- ...
other arguments used to modify layers
Value
a ggproto object
Details
Serial axes coordinate system (parallel or radial) is different from the
Cartesian coordinate system or its transformed system (say polar in ggplot2)
since it does not have a formal transformation
(i.e. in polar coordinate system, "x = rcos(theta)", "y = rsin(theta)").
In serial axes coordinate system, mapping aesthetics does not really require "x" or "y". Any "non-aesthetics"
components passed in the mapping system will be treated as an individual axis.
To project a common geom layer on such serialaxes,
users can customize function add_serialaxes_layers.
Potential Risk
In package ggmulti, the function ggplot_build.gg is provided.
At the ggplot construction time, the system will call ggplot_build.gg
first. If the plot input is not a CoordSerialaxes coordinate system, the next method
ggplot_build.ggplot will be called to build a "gg" plot; else
some geometric transformations will be applied first, then the next method
ggplot_build.ggplot will be executed. So, the potential risk is, if some other packages
e.g. foo, also provide a function ggplot_build.gg that is used for their
specifications but the namespace is beyond the ggmulti (ggmulti:::ggplot_build.gg is
covered), error may occur. If so, please consider using the
geom_serialaxes.
Examples
if(require("dplyr")) {
# Data
nba <- NBAstats2021 %>%
mutate(
dPTS = PTS - OPTS,
dREB = REB - OREB,
dAST = AST - OAST,
dTO = TO - OTO
)
# set sequence by `axes.sequence`
p <- ggplot(nba,
mapping = aes(
dPTS = dPTS,
dREB = dREB,
dAST = dAST,
dTO = dTO,
colour = Win
)) +
geom_path(alpha = 0.2) +
coord_serialaxes(axes.layout = "radial") +
scale_color_gradient(low="blue", high="red")
p
# quantile layer
p + geom_quantiles(quantiles = c(0.5),
colour = "green", linewidth = 1.2)
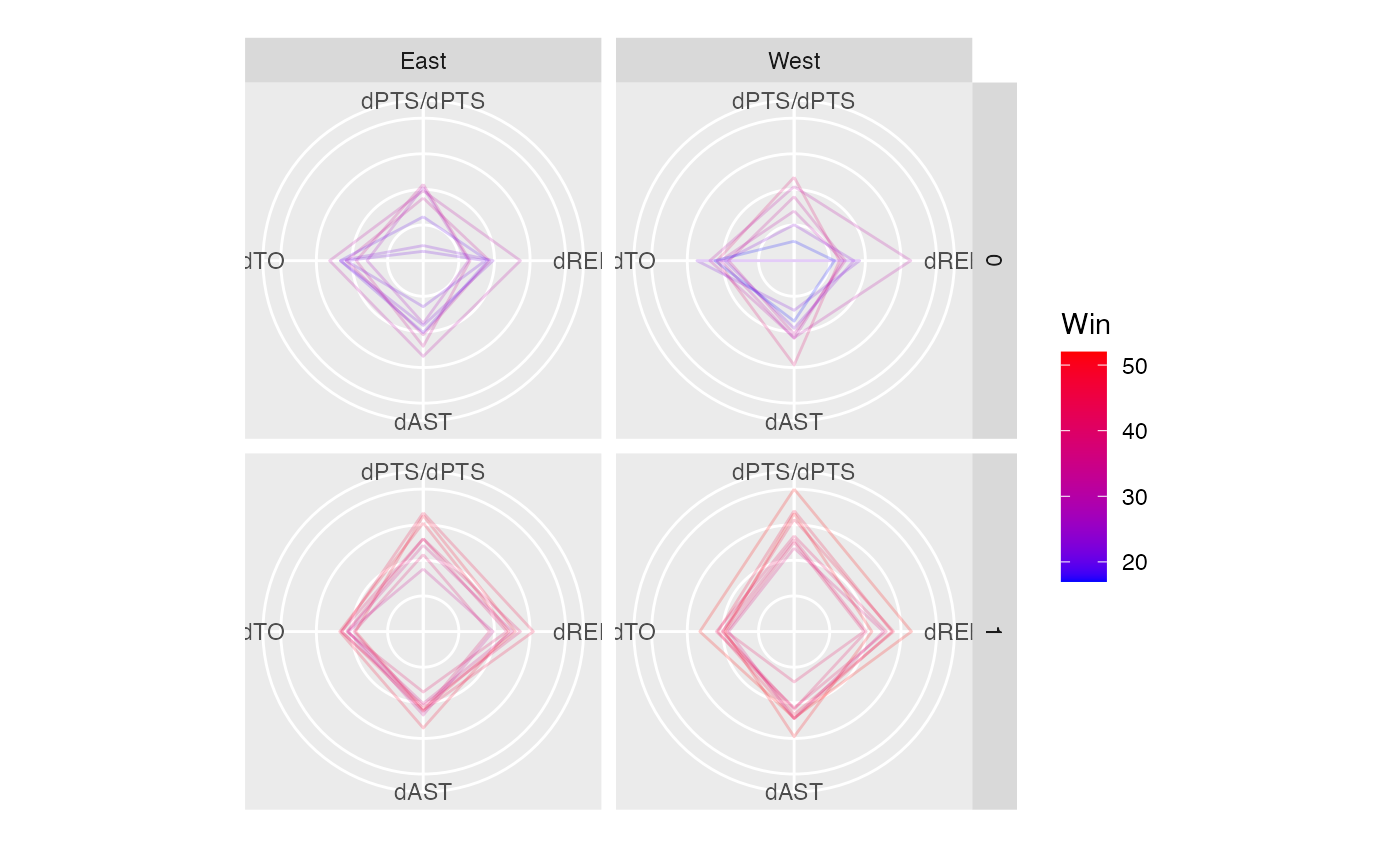
# facet
p +
facet_grid(Playoff ~ CONF)
}