l_plot3D is a generic function for creating interactive
visualization environments for R objects.
Usage
l_plot3D(x, y, z, ...)

# Default S3 method
l_plot3D(
  x,
  y = NULL,
  z = NULL,
  axisScaleFactor = 1,
  by = NULL,
  on,
  layout = c("grid", "wrap", "separate"),
  connectedScales = c("cross", "row", "column", "both", "x", "y", "none"),
  color = l_getOption("color"),
  glyph = l_getOption("glyph"),
  size = l_getOption("size"),
  active = TRUE,
  selected = FALSE,
  xlabel,
  ylabel,
  zlabel,
  title,
  showLabels = TRUE,
  showScales = FALSE,
  showGuides = TRUE,
  guidelines = l_getOption("guidelines"),
  guidesBackground = l_getOption("guidesBackground"),
  foreground = l_getOption("foreground"),
  background = l_getOption("background"),
  parent = NULL,
  ...
)
Arguments
- x
the x, y and z arguments provide the x, y and z coordinates for the plot. Any reasonable way of defining the coordinates is acceptable. See the function xyz.coords for details.
If supplied separately, they must be of the same length.
- y
the y coordinates of points in the plot, optional if x is an appropriate structure.
- z
the z coordinates of points in the plot, optional if x is an appropriate structure.
- ...
named arguments to modify plot states.
- axisScaleFactor
the amount to scale the axes at the centre of the rotation. Default is 1. All numerical values are acceptable (0 removes the axes, < 0 inverts the direction of all axes.)
- by
loon plot can be separated by some variables into multiple panels. This argument can take a
formula,ndimensional state names (seel_nDimStateNames) ann-dimensionalvectoranddata.frameor alistof same lengthsnas input.- on
if the
xorbyis a formula, an optional data frame containing the variables in thexorby. If the variables are not found in data, they are taken from environment, typically the environment from which the function is called.- layout
layout facets as
'grid','wrap'or'separate'- connectedScales
Determines how the scales of the facets are to be connected depending on which
layoutis used. For each value oflayout, the scales are connected as follows:layout = "wrap":Across all facets, whenconnectedScalesis"x", then only the "x" scales are connected"y", then only the "y" scales are connected"both", both "x" and "y" scales are connected"none", neither "x" nor "y" scales are connected. For any other value, only the "y" scale is connected.
layout = "grid":Across all facets, whenconnectedScalesis"cross", then only the scales in the same row and the same column are connected"row", then both "x" and "y" scales of facets in the same row are connected"column", then both "x" and "y" scales of facets in the same column are connected"x", then all of the "x" scales are connected (regardless of column)"y", then all of the "y" scales are connected (regardless of row)"both", both "x" and "y" scales are connected in all facets"none", neither "x" nor "y" scales are connected in any facets.
- color
colours of points; colours are repeated until matching the number points. Default is found using
l_getOption("color").- glyph
the visual representation of the point. Argument values can be any of
the string names of primitive glyphs:
circles: "circle", "ccircle", "ocircle";squares or boxes: "square", "csquare", "osquare";triangles: "triangle", "ctriangle", "otriangle";diamonds: "diamond", "cdiamond", or "odiamond".
l_primitiveGlyphs().the string names of constructed glyphs:
text as glyphs: seel_glyph_add_text()point ranges: seel_glyph_add_pointrange()polygons: seel_glyph_add_polygon()parallel coordinates: seel_glyph_add_serialaxes()star or radial axes: seel_glyph_add_serialaxes()or any plot created using R: seel_make_glyphs()
- size
size of the symbol (roughly in terms of area). Default is found using
l_getOption("size").- active
a logical determining whether points appear or not (default is
TRUEfor all points). If a logical vector is given of length equal to the number of points, then it identifies which points appear (TRUE) and which do not (FALSE).- selected
a logical determining whether points appear selected at first (default is
FALSEfor all points). If a logical vector is given of length equal to the number of points, then it identifies which points are (TRUE) and which are not (FALSE).- xlabel
Label for the horizontal (x) axis. If missing, one will be inferred from
xif possible.- ylabel
Label for the vertical (y) axis. If missing, one will be inferred from
y(orx) if possible.- zlabel
Label for the third (perpendicular to the screen) (z) axis. If missing, one will be inferred from
z(orx) if possible.- title
Title for the plot, default is an empty string.
- showLabels
logical to determine whether axes label (and title) should be presented.
- showScales
logical to determine whether numerical scales should be presented on both axes.
- showGuides
logical to determine whether to present background guidelines to help determine locations.
- guidelines
colour of the guidelines shown when
showGuides = TRUE. Default is found usingl_getOption("guidelines").- guidesBackground
colour of the background to the guidelines shown when
showGuides = TRUE. Default is found usingl_getOption("guidesBackground").- foreground
foreground colour used by all other drawing. Default is found using
l_getOption("foreground").- background
background colour used for the plot. Default is found using
l_getOption("background").- parent
a valid Tk parent widget path. When the parent widget is specified (i.e. not
NULL) then the plot widget needs to be placed using some geometry manager liketkpackortkplacein order to be displayed. See the examples below.
Value
if the argument by is not set, a loon widget will be returned;
else an l_facet object (a list) will be returned and each element is
a loon widget displaying a subset of interest.
Details
l_help() function call. The general direct manipulation and interaction gestures are outlined in the following figures.
Rotating
Press 'R' to toggle rotation mode. When rotation mode is active, either use the below mouse gestures or arrow keys to rotate the plot.
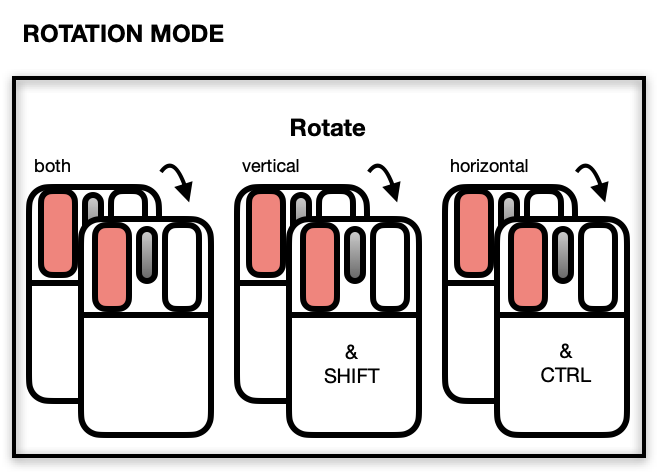
The centre of the rotation can be changed by panning the plot. To reset the rotation, use the tripod icon in the plot inspector.
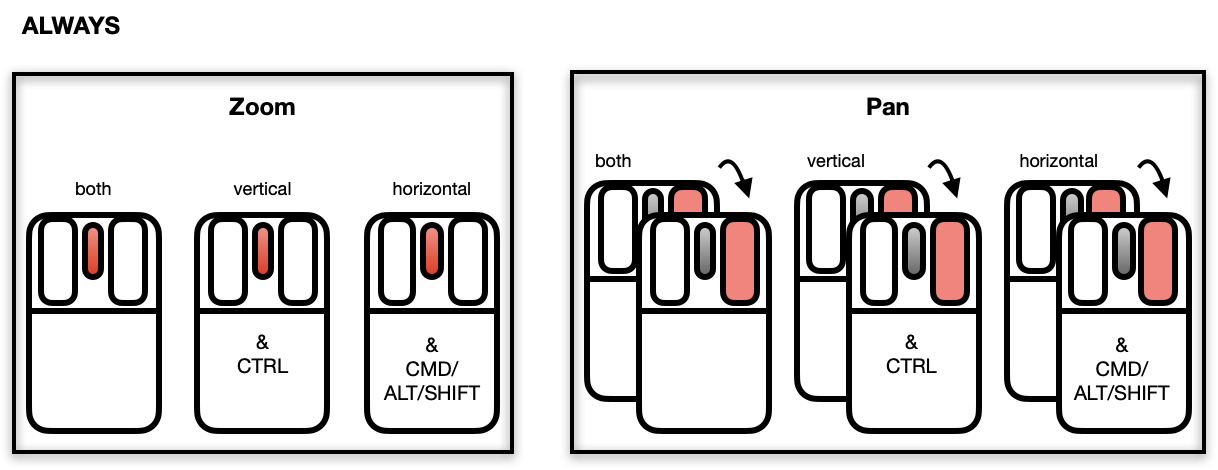
Zooming and Panning
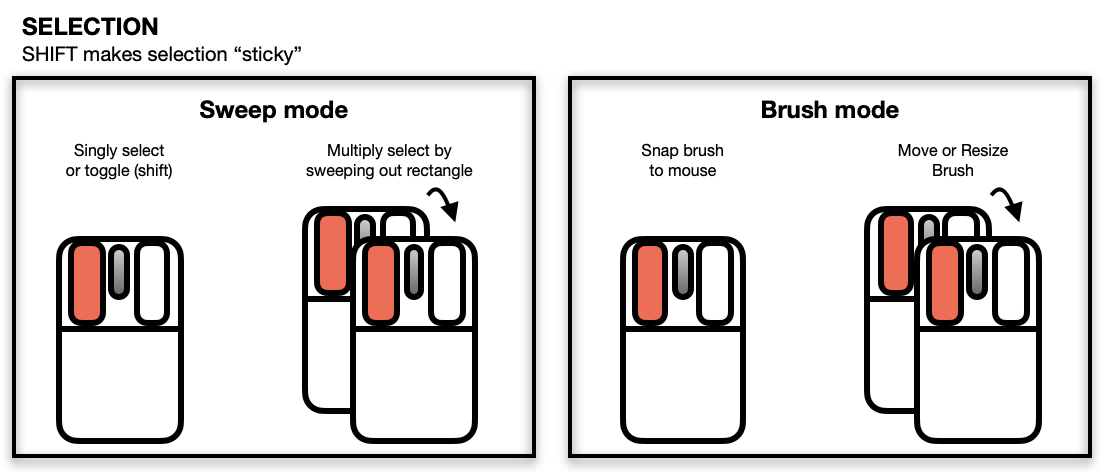
Selecting Points/Objects
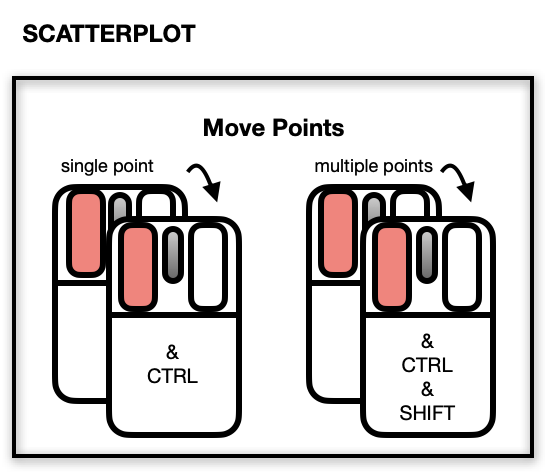
Moving Points on the Scatterplot Display
NOTE: Although it is possible to programmatically add layers to an l_plot3D, these will not appear as part of the 3D plot's display. There is no provision at present to incorporate rotation of 3D geometric objects other than point glyphs.
The scatterplot displays a number of direct interactions with the
mouse and keyboard, these include: rotating, zooming towards the mouse cursor using
the mouse wheel, panning by right-click dragging and various selection
methods using the left mouse button such as sweeping, brushing and
individual point selection. See the documentation for l_plot3D
for more details about the interaction gestures.
Examples
if(interactive()){

with(quakes,
     l_plot3D(long, lat, depth, linkingGroup = "quakes")
)


with(l_scale3D(quakes),
     l_plot3D(long, lat, depth, linkingGroup = "quakes")
)

scaled_quakes <- l_scale3D(quakes)
with(scaled_quakes,
     l_plot3D(long, lat, depth, linkingGroup = "quakes")
)

with(scaled_quakes,
     l_plot3D(mag, stations, depth, linkingGroup = "quakes")
)

# Or together:
with(scaled_quakes,{
     l_plot3D(long, lat, depth, linkingGroup = "quakes")
     l_plot3D(mag, stations, depth, linkingGroup = "quakes")
     }
)

}
if(interactive()){

# default use as scatterplot

p1 <- with(quakes,
           l_plot3D(long, lat, depth)
           )

p2 <- with(quakes,
           l_plot3D(mag, stations, depth)
           )

# link the two plots p1 and p2
l_configure(p1, linkingGroup = "quakes", sync = "push")
l_configure(p2, linkingGroup = "quakes", sync = "push")

}