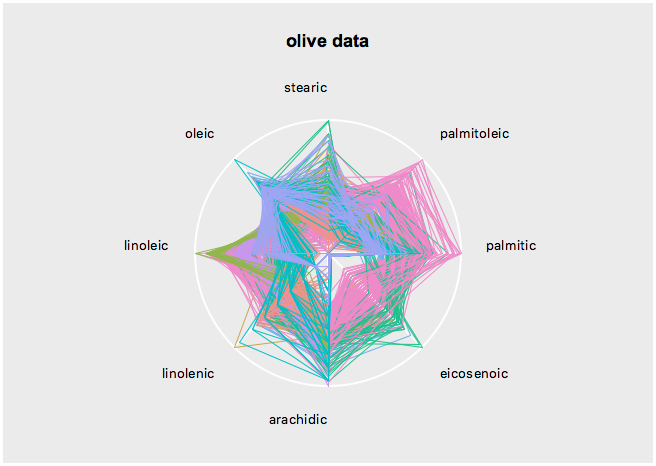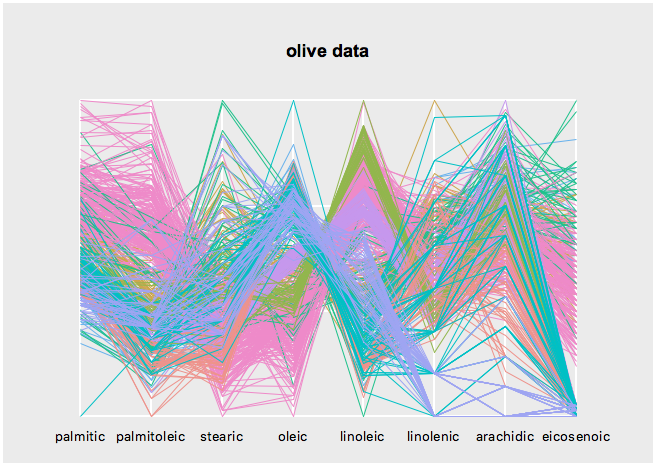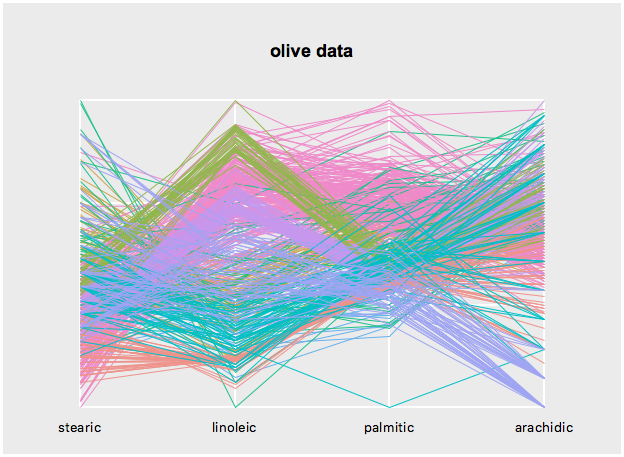

namespace import loon::*
set Area [dict get $loon::data::olive Area]; puts "create Area variable"
set oliveacids [dict filter $loon::data::olive script {key value} {
    expr {$key ni {Area Region}}
}]; puts "filter data"

set s [serialaxes -data $oliveacids -color $Area -title "olive data"]
$s configure -axesLayout parallelGet the state names with
set states [$s info states]
dict keys $states
Query a state, say sequence, as follows
$s cget -sequenceChange a state, say again sequence, as follows
$s configure -sequence {stearic linoleic palmitic arachidic}
When creating a plot you may specify any state at plot creation
set s1 [serialaxes -data $olive -color $Area -title "olive data"\
    -sequence [lrange [dict keys $olive] 2 end]]
details on a state, say sequence, is easily had with
set states [$s info states]
dict get $states sequence
and a particular field
dict get $states sequence descriptionThe scaling state defines how the data is scaled. The axes display 0 at one end and 1 at the other. For the following explanation assume that the data is in a nxp dimensional matrix. The scaling options are then