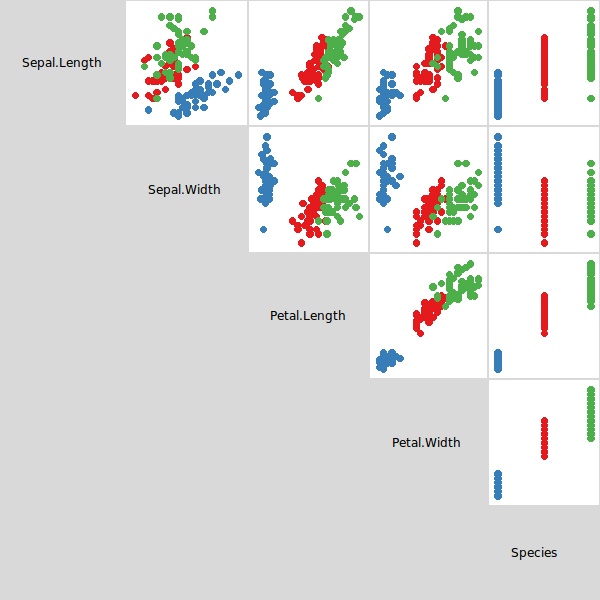

ps <- l_pairs(data=iris, color=iris$Species)data argument does not refer to a state and, therefore, cannot be changed after creation.Note that in the above example ps is a list with the individual scatterplot handles. Use
names(ps)to figure out which plot handle is associated with which handle.
To reset the zoom and pan for each display to show all points you could use l_scaleto_plot or l_scaleto_world for each plot on the diagonal. However it is easier to just evaluate the function on all plot handles:
sapply(ps, l_scaleto_plot)