
namespace import loon::*
# extract variables
dict for {name value} $loon::data::olive {set $name $value}

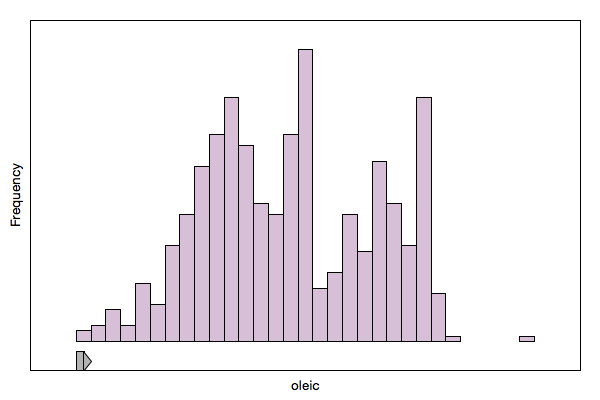
set h [histogram -x $oleic -xlabel oleic]
or alternatively
set h [loon::histogram -x [dict get $loon::data::olive oleic] -xlabel oleic]Get the state names with
set states [$h info states]
dict keys $states
Query a state, say showBinHandle, as follows
$h cget -showBinHandleChange a state, say again showBinHandle, as follows
$h configure -showBinHandle FALSEWhen creating a plot you may specify any state at plot creation
set h1 [histogram -x $oleic, -showBinHandle FALSE\
    -yshows density -color $Area -showStackedColors TRUE]
details on a state, say showBinHandle, is easily had with
set states [$h info states]
dict get $states showBinHandle
and a particular field
dict get $states showBinHandle descriptionWhen changing yshows to frequency or density per command line, you probably have to re-scale the plot as the y ranges of the histogram visualization changes
$h scaleto world When changing yshows via the inspector the rescaling happens automatically.
When changing the bin handles when yshows is density the histogram is re-scaled every time the bin handle changes.
The histogram display supports layers.