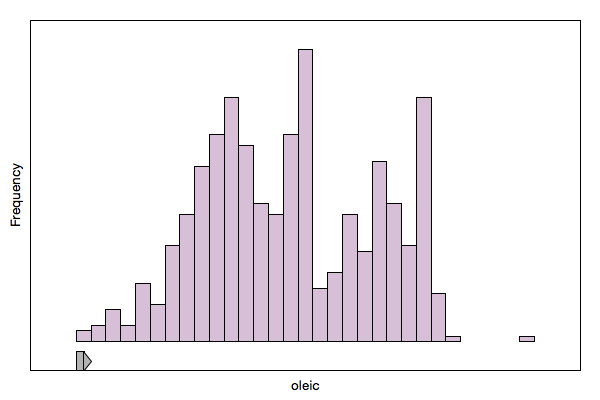

data(olive)
h <- l_hist(x=olive$oleic)Get the state names with
states <- l_info_states(h)
names(states)
Query a state, say showBinHandle, as follows
h['showBinHandle']Change a state, say again showBinHandle, as follows
h['showBinHandle'] <- FALSEalternatively, especially if you need to modify more than one state, use
l_configure(h, showBinHandle=FALSE)When creating a plot you may specify any state at plot creation
h1 <- l_hist(x=olive$oleic, showBinHandle=FALSE, yshows='density',
    color=olive$Area, showStackedColors=TRUE)
details on a state, say showBinHandle, is easily had with
states <- l_info_states(h)
states$showBinHandle
and a particular field
states$showBinHandle$descriptionWhen changing yshows to frequency or density per command line, you probably have to re-scale the plot as the y ranges of the histogram visualization changes
l_scaleto_world(h)When changing yshows via the inspector the rescaling happens automatically.
When changing the bin handles when yshows is density the histogram is re-scaled every time the bin handle changes.
The histogram display supports layers.